New Relicでお家ネットワークを監視する
はじめに
家のネットワークはRTX830でGMOのV6プラスを利用している。
ネットワーク監視には興味があったものの、やる必要性がそこまで感じられなかったので放置していたが、一日の通信量が気になったり、仕事で使っているNew RelicがSNMPに対応しているということで、この際New Relicとお友達になろうと少しずつ触ったので備忘録。
環境
色々試した結果、家に転がっていたRaspberry Pi 3 B+にManjaroを入れて運用していく方針にした。
検証中はWindowsだったりCentosだったり色々試した。
- Windows(メインPC)
- 常時稼働するわけじゃないから
- New Relic SNMPエージェントが上手く動かなかった。
-
- apt-get が動かなかった。
apt-get install unclear and not working · Issue #26 · newrelic/nri-snmp
-
- 動いたけど、メインPCのHyper-vじゃ常時稼働問題
- サーバー増やしたくない
- Raspberry Pi OS
- apt-get 問題+バイナリ落としても動かなかった。
New Relic
New Relicとお友達になろうと思ったきっかけは、個人で使用する分には無料枠で収まると知ったから。 New RelicでSNMPのデータを扱うには、New RelicエージェントとSNMPアドオンをインストールする必要がある。
インストール
wget https://download.newrelic.com/infrastructure_agent/binaries/linux/arm/newrelic-infra_linux_1.17.1_arm.tar.gz
tar xvzf newrelic-infra_linux_1.17.1_arm.tar.gz
sudo ./installer.sh
サービスが立ち上がっているか確認する。
$ systemctl status newrelic-infra.service
● newrelic-infra.service - New Relic Infrastructure Agent
     Loaded: loaded (/etc/systemd/system/newrelic-infra.service; enabled; vendor preset: disabled)
     Active: active (running) since Sun 2021-05-16 02:20:07 JST; 23s ago
   Main PID: 4600 (newrelic-infra-)
      Tasks: 18 (limit: 783)
        CPU: 2.982s
     CGroup: /system.slice/newrelic-infra.service
             ├─4600 /usr/local/bin/newrelic-infra-service -config=/etc/newrelic-infra.yml
             └─4606 /usr/local/bin/newrelic-infra -config=/etc/newrelic-infra.yml
nri-snmp をインストール&エージェントの設定の為に一旦サービスを停止する。
sudo systemctl stop newrelic-infra.service
nri-snmp のインストール
mkdir nri-snmp
cd nri-snmp
wget https://github.com/newrelic/nri-snmp/releases/download/v1.3.0/nri-snmp_linux_1.3.0_arm64.tar.gz
tar xvzf nri-snmp_linux_1.3.0_arm64.tar.gz
シンボリックリンクを張る。
cd /var/db/newrelic-infra/newrelic-integrations
sudo ln -s ~/nri-snmp/var/db/newrelic-infra/newrelic-integrations/newrelic-integrations
sudo ln -s ~/nri-snmp/var/db/newrelic-infra/newrelic-integrations/bin/
sudo ln -s ~/nri-snmp/var/db/newrelic-infra/newrelic-integrations/snmp-definition.yml

cd /etc/newrelic-infra/integrations.d/
sudo ln -s ~/nri-snmp/etc/newrelic-infra/integrations.d/
sudo ln -s ~/nri-snmp/etc/newrelic-infra/integrations.d/snmp-config.yml
sudo ln -s ~/nri-snmp/etc/newrelic-infra/integrations.d/snmp-metrics.yml
設定
nri-snmp を動かすには3つの設定ファイルが必要。
- newrelic-infra.yml // New Relic定義ファイル
- snmp-config.yml // SNMPインテグレーション定義ファイル
- snmp-metrics.yml // SNMPメトリクス定義ファイル
newrelic-infra.yml
/etc/newrelic-infra.yml にある。
license_key を設定する必要がある。
New Relicの API keys より INGEST - LICENSE の値を取得し貼り付ける。
# /etc/newrelic-infra.yml
pid_file: /var/run/newrelic-infra/newrelic-infra.pid
plugin_dir: /etc/newrelic-infra/integrations.d/
agent_dir: /var/db/newrelic-infra/
log_file: /var/log/newrelic-infra/newrelic-infra.log
license_key: xxxxxxxxxxxxxxxxxxxxxxxxxxxxx
snmp-config.yml
~/nri-snmp/etc/newrelic-infra/integrations.d/snmp-config.yml
SNMPの設定を定義する。
instances:
  - name: snmp
    command: all_data
    arguments:
      snmp_host: 192.168.x.x
      snmp_port: 161
      community: public
      collection_files: "/etc/newrelic-infra/integrations.d/snmp-metrics.yml"
snmp-metrics.yml
~/nri-snmp/etc/newrelic-infra/integrations.d/snmp-metrics.yml
New Relicに送信するメトリクスを定義する。
event_type 、 metric_name はNew Relicのクエリで使用するのでよしなに。
ifHCxxOctets(Counter64)は metric_type を指定しないとNew Relic側でGaugeとして処理されてしまったので明示的に定義した。
collect:
- device: RTX830-MIB
  metric_sets:
  - name: RTX830 metric
    type: scalar
    event_type: Rtx830Metric
    metrics:
    - metric_name: ifHCInOctets_1 #LAN
      oid: .1.3.6.1.2.1.31.1.1.1.6.1
      metric_type: pdelta
    - metric_name: ifHCInOctets_2 #WAN
      oid: .1.3.6.1.2.1.31.1.1.1.6.2
      metric_type: pdelta
    - metric_name: ifHCOutOctets_1
      oid: .1.3.6.1.2.1.31.1.1.1.10.1
      metric_type: pdelta
    - metric_name: ifHCOutOctets_2
      oid: .1.3.6.1.2.1.31.1.1.1.10.2
      metric_type: pdelta
    - metric_name: yrhMultiCpuUtil5sec_1
      oid: .1.3.6.1.4.1.1182.2.1.18.1.3.1
    - metric_name: yrhMultiCpuUtil1min_1
      oid: .1.3.6.1.4.1.1182.2.1.18.1.4.1
    - metric_name: yrhMultiCpuUtil5min_1
      oid: .1.3.6.1.4.1.1182.2.1.18.1.5.1
    - metric_name: yrhMultiCpuUtil5sec_2
      oid: .1.3.6.1.4.1.1182.2.1.18.1.3.2
    - metric_name: yrhMultiCpuUtil1min_2
      oid: .1.3.6.1.4.1.1182.2.1.18.1.4.2
    - metric_name: yrhMultiCpuUtil5min_2
      oid: .1.3.6.1.4.1.1182.2.1.18.1.5.2
起動
sudo systemctl start newrelic-infra.service
設定が正しければNew Relicの管理画面でグラフが見えるようになる。
Infrastructure>Hosts
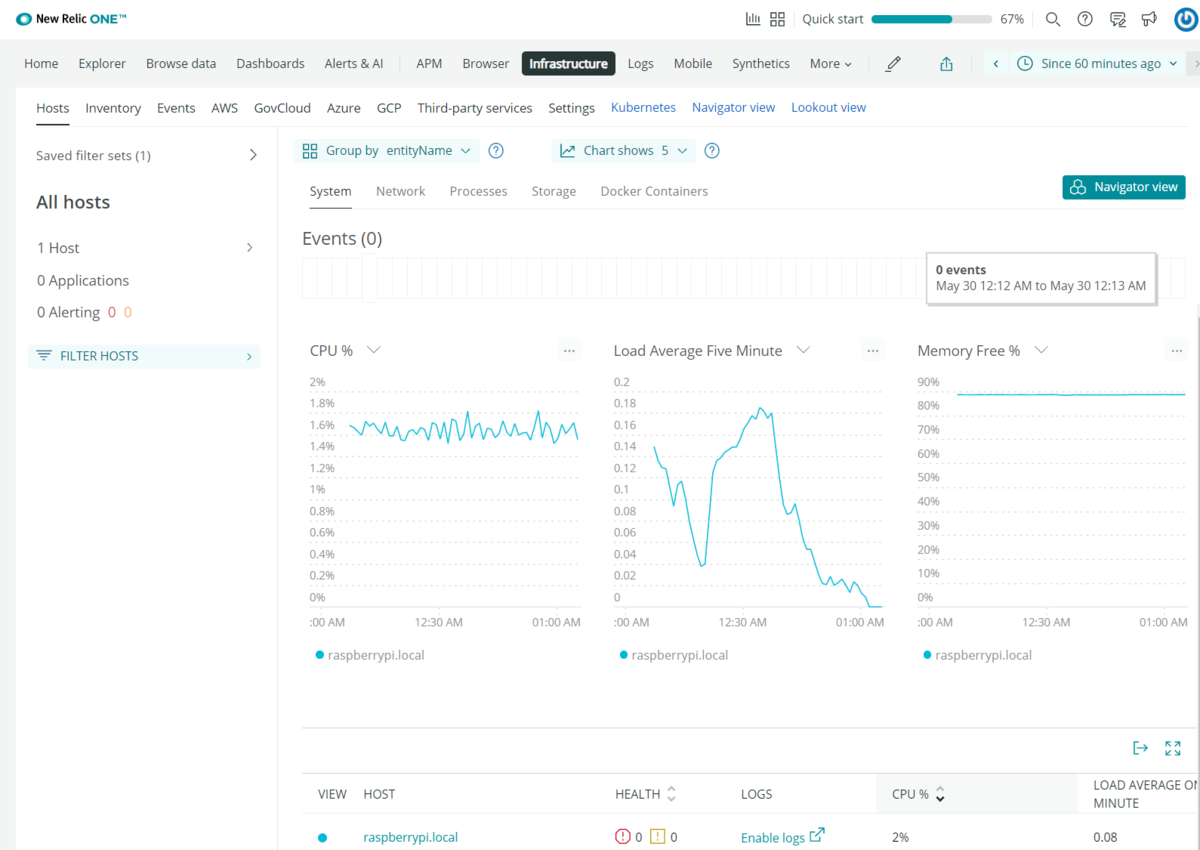
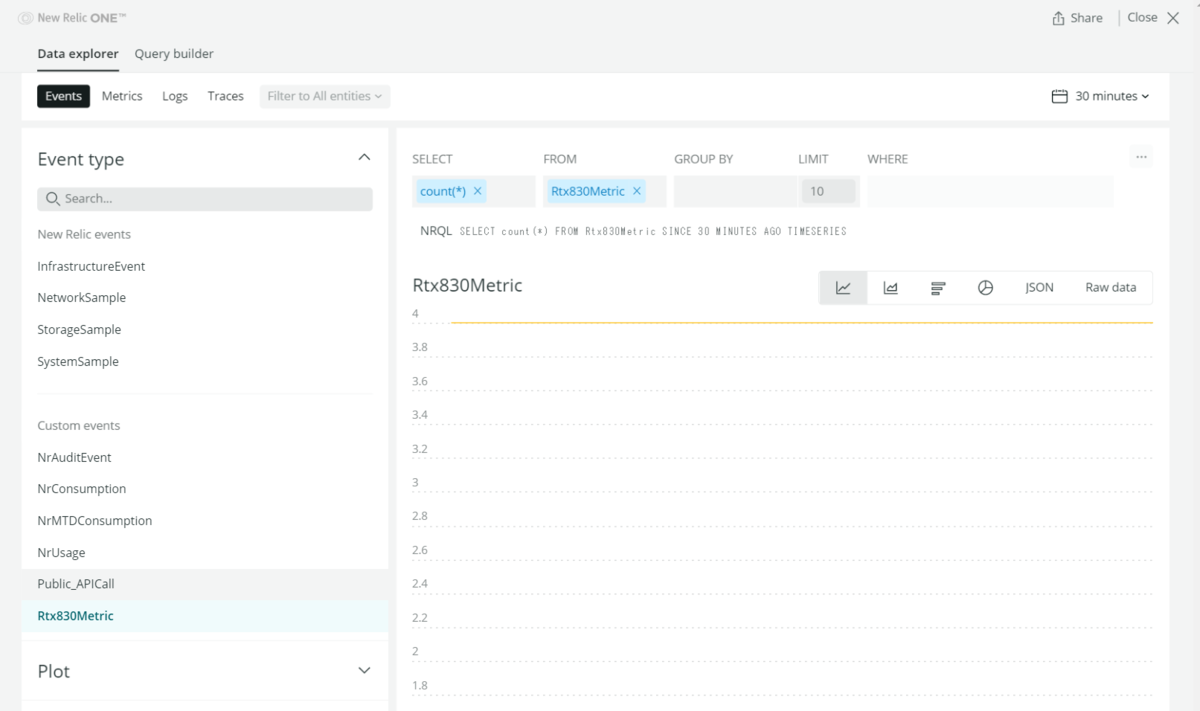
SNMPメトリクスが取得できているか確認。
Browse data>Data explorer に Rtx830Metric があればOK。なければ何かしらのエラーが出ている。
ダッシュボードの作成
NRQLというSQLライクな構文で簡単にグラフが作成できる。ぬるくるぬるくる。
例えば
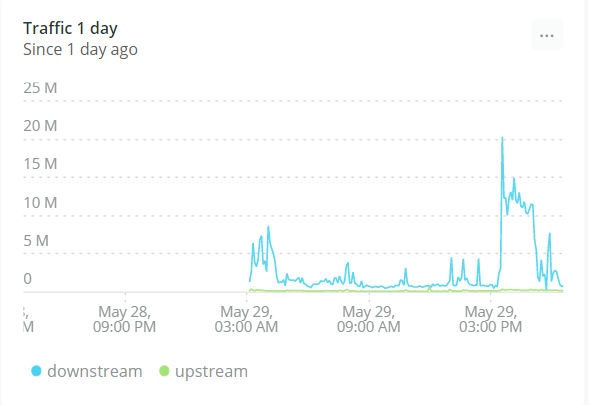
- 一日の通信量を
- 5分刻みで
- 上りと下りのそれぞれをグラフ化
をNRQLで書くとこうなる。
FROMのRtx830Metric はsnmp-metrics.yml のevent_type、SELECTのifHCInOctets_2などはmetric_nameになる。
SELECT average(ifHCInOctets_2) as downstream, average(ifHCOutOctets_2) as upstream FROM Rtx830Metric TIMESERIES 5 minutes SINCE 1 day ago
まとめ
New RelicでSNMPのデータを扱ってみた。日本語ソースどころか英語でもあまり取り扱われていなかったのでなかなか苦労した。
今後はSyslogもダッシュボードに入れてみたい。